
The U.S. Department of Education recently released its annual report on the federal Pell Grant program, which provides detailed information about the program’s finances and who is receiving grants. The most recent report includes data from the 2014-15 academic year, and I summarize the data and trends over the last two decades in this post. (Very preliminary data on Pell receipt for the first three quarters of the 2015-16 academic year can be found in the Title IV program volume reports on the Office of Federal Student Aid’s website.)
For the third year in a row, the number of Pell recipients fell, going from a peak of 9.44 million students in 2011-12 to 8.32 million in 2014-15 (a 12% decrease). This drop in recipients is almost entirely due to students who are considered independent for financial aid purposes (typically students who are at least 24 years of age, are married, or have a child). The number of independent Pell recipients fell by 18% in the last three years (to 4.56 million), while the number of dependent Pell recipients fell by just 2.7% (to 3.75 million), as shown in the chart below. However, independent students still make up the majority of Pell recipients, as they have every year since 1993.

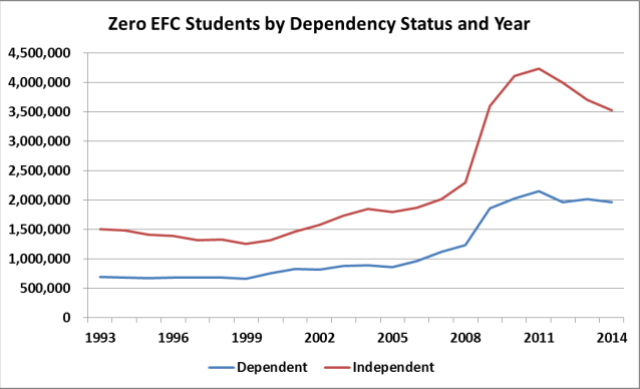
There has been an even larger drop in the number of students with zero expected family contribution, who automatically qualify for the maximum Pell Grant. (For more on these students, check out this article I wrote in the Journal of Student Financial Aid last year.) Nearly 900,000 fewer students received a zero EFC since 2011-12, with decreases of 9% among dependent students and 17% among independent students.
In the next chart, I show the number of students receiving Pell Grants by sector since 1993. The number of Pell recipients dropped by almost 225,000 students at community colleges and 230,000 students at for-profit colleges between 2013-14 and 2014-15, while Pell enrollment at both public four-year and private nonprofit colleges increased by about 55,000 students each. Since 2011-12, community college Pell enrollment is down by 17% and for-profit Pell enrollment is down 26%, while other sectors are basically flat. These trends fit well with economic conditions, as more vocationally-oriented colleges see enrollment spikes during recessions and sizable drops during better times (like today).

Expenditures for the Pell Grant program declined for a fourth consecutive year, going from $35.7 billion (in nominal dollars) in 2010-11 to $30.6 billion in 2014-15. However, in inflation-adjusted dollars, Pell spending has still more than doubled since 2007-08.

The large decrease in Pell expenditures led to a $7.8 billion surplus in the Pell program going forward, but Congress has plans to spend part of that surplus. A U.S. Senate subcommittee approved bringing back year-round Pell Grants (an idea with strong bipartisan support that would allow students to get Pell Grants for more than two full-time semesters per year) as well as transferring some of the funding to the National Institutes of Health and K-12 education. But will Pell expenditures continue to drop? It’s possible if the economy continues to improve while parts of the for-profit college sector continue to collapse, but the trend toward a more economically diverse group of young adults will likely increase Pell enrollment in future years.
[Cross-posted at Kelchen on Education]


