
Data revised 12/2/2016
I’m not saying the system is rigged but a stunning reality now has to be faced: the distribution of political power is more disconnected than ever from the distribution of votes.
The 2016 election produced a massive consolidation of power for Republicans, who now control the White House, the Senate and the House, which has happened for only 4 years out of the last 60. And yet…
Public opinion: Exit polls in the same election that produced this massive GOP triumph had this finding: 40% of voters viewed Republicans favorably compared to 47% for the Democrats.
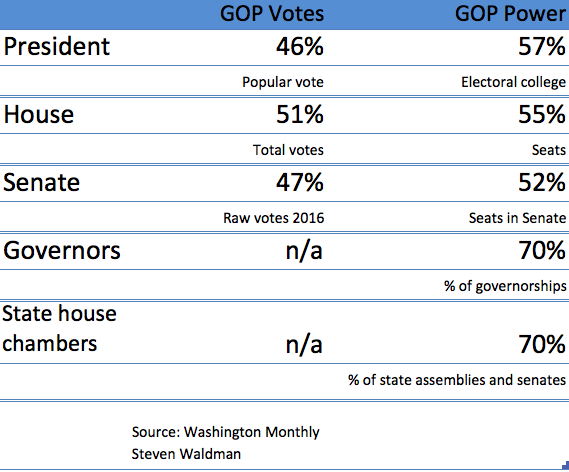
Popular vote: Trump is losing the popular vote by about at 2.5 million (as of 12/1/16). That means he’ll get about 46% of the votes cast by humans but 57% of the electoral college. In fact, a case could be made that this election had the biggest disconnect between the popular vote and the electoral college result in American history.
Senate: As of 11/10/2016, 45.2 million Americans voted for a Democratic Senate candidate vs. 39.3 million who voted for a Republican. So Democrats won 53% of the vote this year but have 46%-48% of the Senators.
House of Representatives: It’s not usually meaningful to count up the total House votes. Many representatives run unopposed, which depresses vote counts in those districts. But in general through the last century, the party that has controlled the House also got the most votes. But In the 2012 election, something unusual happened: Democrats won 50.59 percent of the two-party vote – but just 46% of the seats in the House of Representatives. In 2016, it appears the Republicans won 51% of the vote and 55% of the seats. The Cook Report’s Dave Wasserman summarizes:
House GOP’s 4% geography bonus:
2012: 49% of 2-party vote, 53% of seats
2014: 53% of vote, 57% of seats
2016: 51% of vote, 55% of seats— Dave Wasserman (@Redistrict) December 1, 2016
State legislatures: We supposedly live in an evenly divided country, yet as of today nearly 70% of the state legislative chambers are controlled by Republicans. 24 states will have total Republican control while only six have Democratic control. That’s the biggest gap since the 1920s. Republicans also have 70% of the governorships.
In terms of the total number of state legislators, we don’t yet have the results for this year but as of November 1, 2016, 55% of state legislators were Republican and 41% were Democrats.
There are several reasons for this. Obviously the disconnect between popular vote and the winner stems from the peculiarities of the electoral college. But those distortions seem to be made worse by the fact that the Democrats tend to live increasingly in cities, and that a huge number of them are packed into a few large solidly blue states.
Big Blue States — those with more than 10 electoral votes and where the Democrats got more than 55% of the vote — included: California, New York, Massachusetts, Illinois and Maryland. Large states in which the Republicans got more than 55%: Indiana, Missouri and Tennessee.
The other big cause, of course, is gerrymandering, which exists both for congressional seats and state legislatures. The Republicans have been better at winning state legislative seats and then distorting the electoral maps to maximize their numbers. Their job is made easier by the Democratic voters being concentrated tightly in urban areas.
Finally, some voters are pro-Trump, anti-Republican. That helps explain how Trump could be triumphant while the Republican Party is held in lower regard than Democrats. Alas,Trump’s victory led to far greater power for the Republicans he criticized.


_(2).jpg)