Presidential approval numbers are often used to predict re-election chances. According to FiveThirtyEight, Trump stands at 42.6 percent, which is better than it was during the government shutdown, but still doesn’t bode well for him.
That polling question is usually tracked at the national level, which gives us an overall picture of the president’s performance, but isn’t that helpful when it comes to how it will play out in the electoral college. That is why Gallup’s recent release of Trump’s job approval rating by states is worth taking a look at.

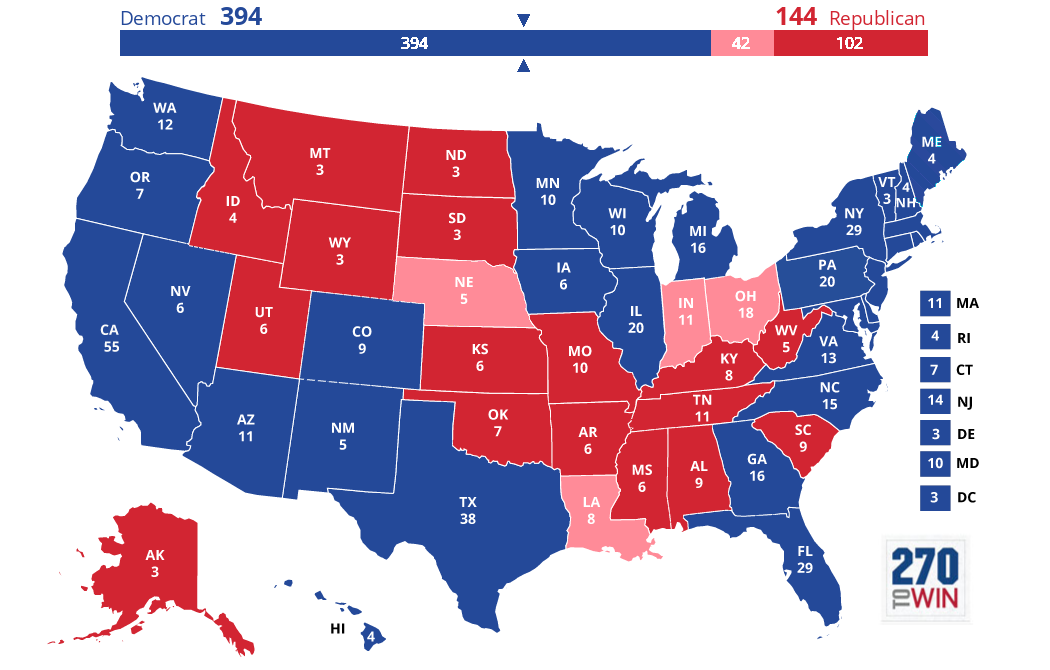
The president’s job approval rating is 50 percent or above in 17 states, which would account for a combined total of only 102 electoral votes. I thought it would be interesting to give him the benefit of the doubt and assume that he’d win in states where his job approval was higher than 45 percent. Here’s what the electoral map would look like under those circumstances.
States in pink would be the so-called “battlegrounds” where Trump’s approval rating is between 46-49 percent. The total number of electoral votes would be exactly the same if you give Trump states where his disapproval level is lower than 50 percent.
This is all just for fun right now, because the election is still almost two years away and there isn’t a direct correlation between job approval rating and votes. Nevertheless, it’s still interesting to note that Trump has a significantly higher job approval rating in Ohio (48 percent) than he does in Texas (41 percent) or Georgia (44 percent).
In the end, if the people who don’t approve of Trump’s job performance vote for the Democrat in 2020, we’d see as close to a landslide as we’re going to get under current circumstances.


 Click the map to create your own at