
It’s been a good week for higher education data nerds. The Department of Education released updated student loan cohort default rates on Wednesday afternoon (see my summary here), followed by an update to the massive College Scorecard dataset on Thursday morning. This is the third update to the Scorecard, with this year’s update also featuring a nice new comparison tool on the student-facing version of the site.
In this post, I focus on trends in student loan repayment rates (defined as the percentage of students who have repaid at least $1 in principal) at various periods entering loan repayment. I present data for colleges with unique six-digit Federal Student Aid OPEID numbers (to eliminate duplicate results), weighting the final estimates to reflect the total number of borrowers entering repayment. Additionally, I use the January 2017 data release for the 2012-13 Scorecard data because there appears to be an error in that year’s dataset that results in very few colleges having loan repayment rates.
I begin by show the trends in the 1-year, 3-year, 5-year, and 7-year repayment rates for each cohort of students with available data.
| Repayment cohort | 1-year rate (pct) | 3-year rate (pct) | 5-year rate (pct) | 7-year rate (pct) |
| 2006-07 | 61.8 | 63.5 | 64.6 | 66.6 |
| 2007-08 | 53.0 | 54.2 | 56.1 | 59.7 |
| 2008-09 | 46.1 | 47.9 | 52.0 | 56.0 |
| 2009-10 | 41.0 | 43.2 | 48.7 | N/A |
| 2010-11 | 36.6 | 40.7 | 46.3 | N/A |
| 2011-12 | 32.2 | 38.1 | N/A | N/A |
| 2012-13 | 33.0 | 38.3 | N/A | N/A |
There are two clear trends from this table. First, repayment rates have steadily dropped for more recent cohorts of students. The one-year repayment rate for students entering repayment in 2006-07 (before the Great Recession) was 61.8%, while the most recent cohort of students had a one-year repayment rate of just 33.0%. Much of this decline is likely due to the growth of income-driven repayment plans (which can allow students to be current on their payments while not making a dent in the overall principal). But economic circumstances also likely play a role here.
Second, repayment rates steadily rise for a given cohort as they have more time in the labor market after college. In the 2008-09 repayment cohort, the seven-year repayment rate was 56.0%, 9.9% higher than the one-year rate. These trends still suggest that it will be a long time before students repay their loans, but this is a step in the right direction.
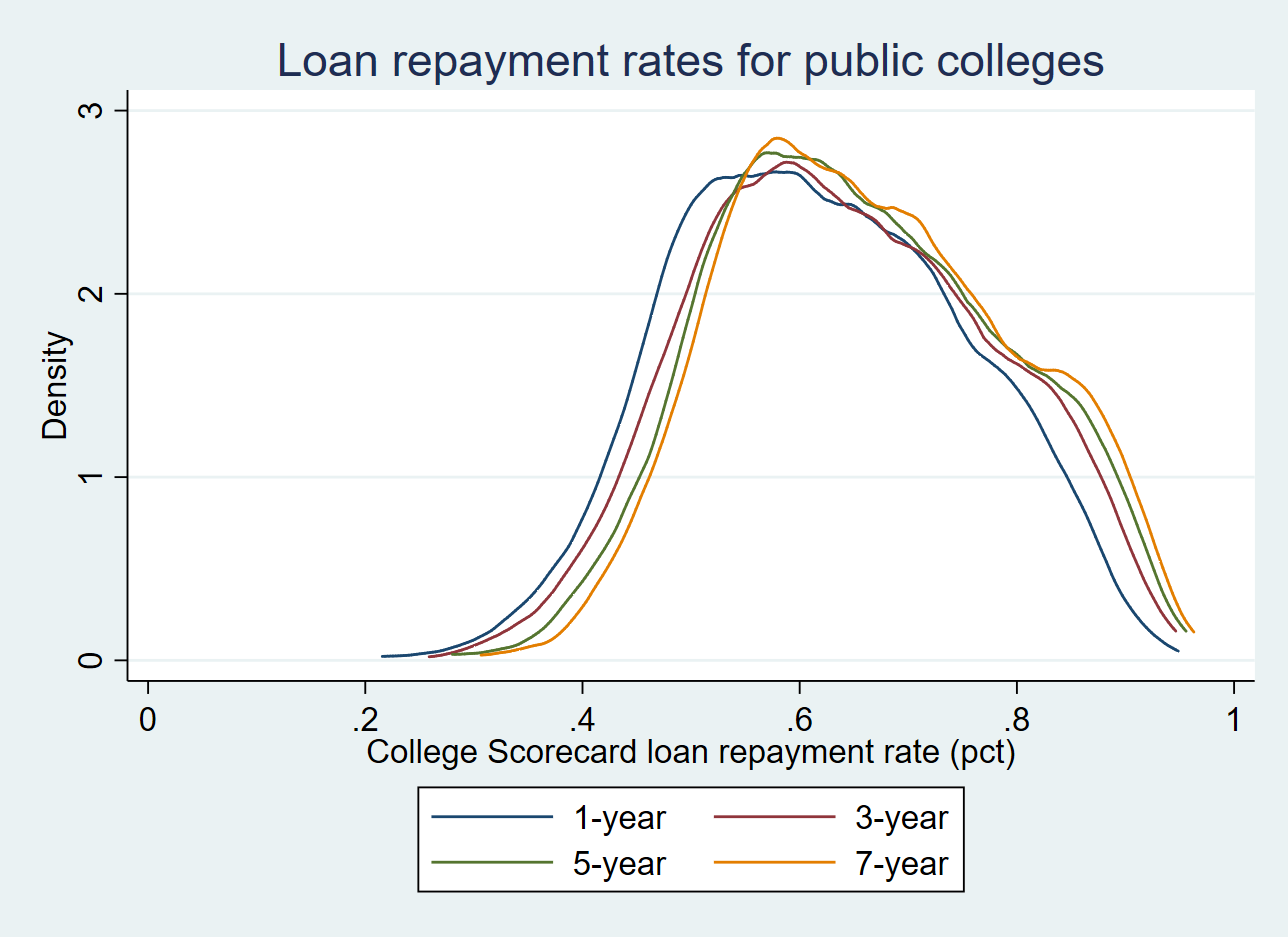
I also show the distribution of colleges’ repayment rates for the 2008-09 cohort across all of the repayment periods by the type of college (public, private nonprofit, and for-profit). In general, private nonprofit colleges have higher repayment rates than both public and for-profit colleges (in part because private nonprofit colleges are primarily four-year institutions), but all sectors see slight improvements between the one-year and seven-year repayment rates.


Finally, a programming note: I’ll be getting the final page proofs for my book shortly and have to do final checks and put together an index during the month of October. I’ll try to write a couple of short blog posts when the new National Postsecondary Student Aid Study and full IPEDS Outcomes Measures survey come out; otherwise, stay tuned for some exciting new research that I’ll be unveiling in early November.
[Cross-posted at Kelchen on Education]


